2022-07-03
term: 2B
Engineering Economics: Financial Management for Engineers, taken in Spring 2019.
meta
Brian P. Cozzarin
- Homework 5%
- Tutorial quiz 5%
- Programming assignment 20 + 5%
- Midterm 30%
- Final 40%
course overview
- introduction to finance
- time value of money
- measures to evaluate investment opportunities - Whether to undertake a single investment?: - Ranking investments:
- loans and amortization tables
- effective interest rates
- capital budgeting
- what is risk
- statistics for portfolios
- portfolio diversification and risk - simple regression in excel
- risk diversification & efficient frontier - uncorrelated assets - correlated assets
- CAPM and SML
- SML
- measuring investment performance
- security market line and the cost of capital
- efficient markets
- bond valuation
- stock valuation
- options
introduction to finance
Lock the reference with $Col$Row, or F4.
8 principles of finance
- Buy assets that add value; avoid buying assets that don’t add value.
- Cash is king.
- The time dimension of financial decisions is important.
- Know how to compute the cost of financial alternatives.
- Minimize the cost of financing.
- Take risk into account.
- Markets are efficient and deal well with information.
- Diversification is important.
5 rules for finance modeling
- Put important variables in one place. Critical parameters == value drivers.
- Don’t hardcode numbers
- No blank columns
- No auto-jump cells
- GetFormula to spreadsheet
time value of money
the second dimension of money: opportunity cost of capital/money in the space of time.
i.e. what you could’ve done with the money in that space of time.
i.e. gain in interest, gains from choosing different stocks…
How to compare different opportunities? Calculate the NPV and IRR of investments. Finance under certainty.
FV
Future value: \(principal \times (1 + rate)^{N}\)
where \(N\) is the number of periods. At higher interest rates, the curve is steeper.
- Beginning of year: interest is not applied
- End of year: interest is applied
In Excel: FV(rate, number of periods, equal payment per term [optional], -present value)
note that present value is negative.
PV
Present value: if you are promised money in the future, how much is it worth today? Taking compound interest of time frame into account
Note that present value and future value are mirror images.
Present value: \(principal \div (1 + rate)^{N}\)
As interest rate increases, present value decreases. i.e. present value at 6% is higher than present value with 35%. See formula.
On Excel, PV computes present value or series of constant payment (annuity stream, ex lottery payouts), all payments are equal. Make negative so that the PV function produces a positive answer.
- Type 0: end-of-period payments
- Type 1: beginning-of-period payments
NPV
On Excel, NPV computes the present value, not the net present value.
This present value is for unequal payments over time, use PV for constant or equal payments over time.
PMT
Payments on flat loan payments. Repays a constant amount over the term, resulting into the total of the loan.
\[PV = \frac{X}{(1 + r)^{1}} + \frac{X}{(1 + r)^{2}} + \frac{X}{(1 + r)^{3}} + ... + \frac{X}{(1 + r)^{N}}\]Use Excel’s PMT to compute loan payments. Parameters needed: rate \(r\), number of periods \(N\), principal value or loan total \(PV\)
Note that \(PV\) is a negative number so that the PMT returns a positive payment.
i.e Saving for an amount 3 methods:
- 1: trial and error
- 2: goal seek
- 3: Excel’s PMT function
Goal Seek computes X.
NPER
RATE
measures to evaluate investment opportunities
Whether to undertake a single investment?:
- 1: determine if the IRR of the project > the initial investment.
- 2: calculate whether the net present value NVP > 0
Ranking investments:
- 1: A over B if \(NPV_A > NPV_B\).
NPV and IRR sometimes give conflicting conclusions. When there is a conflict, use NPV. NPV criteria maximizes wealth. IRR maximizes rate of return.
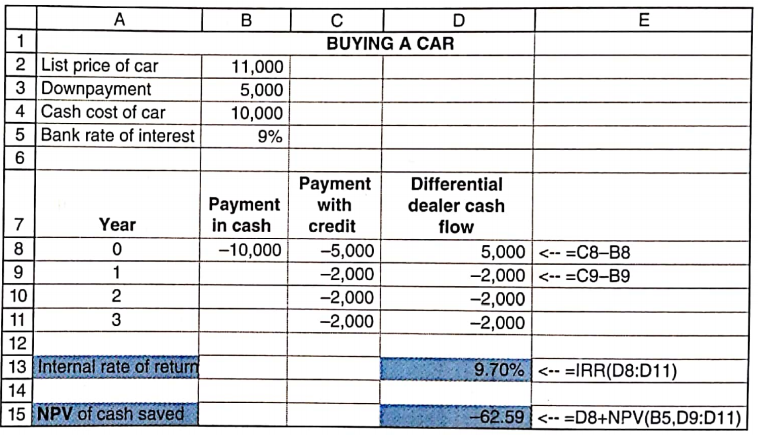
Crossover point where the NPV disagrees with the IRR:
- calculate the differential cash flows
- IRR(differential)
But NPV is always preferred.
Caveat using the NPV as criterion: they need to have the same lifespan.
NPV
Net present value: NPV of a series of future cash flows is the present value of the cash flow, minus the initial investment required
\[NPV = -InitialInvestment + \frac{X}{(1 + r)^{1}} + \frac{X}{(1 + r)^{2}} + \frac{X}{(1 + r)^{3}} + ... + \frac{X}{(1 + r)^{N}}\]In other words: whether or not it’s worth spending the initial investment, depending of whether the net present value taking time into account is positive.
Investment is worthwhile if: \(NPV>0\)
IRR
Internal rate of return, to evaluate new projects (i.e. getting a new computer? starting a new training program?) Represents the discount rate that we obtain if the investment’s NPV is 0. Equivalent to percentage gain.
Excel’s IRR: plotting NPV and seeing when the curve crosses the x-axis (x-intercept) is the IRR percentage.
IRR(values per year)
downsides of IRR
hard to tell when a project is bad
IRR can be over the discount rate, but the NPV can be negative.
MIRR
Modified IRR:
EAC
Equivalent annual cash flows
PI
Profitability index
IRR is where the NPV crosses the x-axis.
i.e. should you build a bridge with a toll?? yes or no, just make an IRR analysis
loans and amortization tables
effective interest rates
capital budgeting
capital budgeting: deciding whether or not to undertake an investment project
2
NPV decision
IRR decision
what is risk
risk is standard deviation
statistics for portfolios
portfolio diversification and risk
portfolio diversification is spreading savings between many assets to smooth out the risk of the portfolio
VFINX: stock symbol of Vanguard’s Index 500 fund. Pries include the dividends paid by the Standard & Poor’s 500 index, hence is the best choice for data on the true returns of the SP 500.
simple regression in excel
method 1
alpha = INTERCEPT(SP500 return, stock return)
beta = SLOPE(SP500 return, stock return)
r-squared = RSQ(SP500 return, stock return)
method 2
graph, use equation estimate to get alpha, beta, rsquared
risk diversification & efficient frontier
uncorrelated assets
diversification of uncorrelated assets improve your investment returns (average return is the same, but risk/standard dev is lowered)
correlated assets
when asset returns are perfectly positively correlated, diversification does not lower risk
when assets are perfectly negatively correlated, diversification can eliminate all risk
CAPM and SML
capital asset pricing model (CAPM) and the security market line (SML)
\(r_f\) is the risk-free asset’s return (i.e. guaranteed interest)
\(E(r_M)\) is the expected return on the market
CML
the capital market line (CML) indicates how an investor should optimally split investments between risky and non-risky assets
\[E(r_p) = (1 - w_m) \times r_f + w_m \times E(r_M)\]- percentage invested in r_f
- and percentage invested in market
equivalent to:
\[E(r_p) = r_f + w_m \times \left[ E(r_M) - r_f \right]\]SML
the security market line (SML) states how the expected return of an asset is related to its risk, and how risk should be measured
measuring investment performance
security market line and the cost of capital
efficient markets
general principles of security valuation
CAGR compound annual growth rate
Chapter 16:
- a = initial cash flow (free cash flow FCF)
- g = constant growth rate
- n = number of periods
- d = discount rate
- r = WACC
as \(n \rightarrow \infty\)
equivalent to: \(PV = \frac{a}{r+d}\) when |g| < |r|
valuation method 1
current market price is the correct valuation (efficient market hypothesis?)
i.e. @ ABC holding company:
percentage of shares owned of X company \(\times\) market value = market value of ABC holdings in X company
valuation method 2
Don’t worry about WACC from the textbook.
Equity cash flow is dividends.
valuation method 3
More reliable in the industry
Price-to-Earning